 Marketing-masterclass-lead-generati...
Welcome to the third and final part of our masterclass series, where we peel back the curtain to shed light some of our most successful Google-oriented campaigns.
Having already dipped our toes into online sales and brand awareness, this time we’re taking the plunge into the churning waters of lead generation. Find out how we drove high-quality leads for a client whose core offering—swimming instruction—almost ended up underwater in the wake of the pandemic. But first, the fundamentals.
-
Strategic, scalable lead generation
We adopt a full-funnel approach to every lead generation campaign, agreeing to measurement models with clients and feeding the right data into the platform to enable machine learning. But it takes a human touch to determine the appropriate level of granularity in campaign/ad group segmentation; an endeavor we’ve mastered in recent years.
As an agency, we manage advertisers with very different business structures, from local franchisees with individually small but collectively large budgets to centralised enterprises with local presence. The former carries a risk of being overly segmented as franchisee-supplied budgets require that each store location have its own campaign.
Even so, local store owners look to us to squeeze the most efficiency out of spend, especially during downturns like a pandemic. The only way we can achieve efficiency at scale for hundreds or thousands of locations is developing and improving automation at every stage of our management.
Furthermore, we look to the whole to improve the performance of the parts. One risk with franchisee-based advertisers—like the client in question—is splintered performance and customer data. We have found that while budgets are segmented, data does not have to be. We use corporate-level data to identify patterns and action them for individual locations. In short, we automate, aggregate, and activate.
-
Which Google Ads products are best for lead gen?
Our methodology emphasises presence across the whole customer journey because lead growth cannot exist without growth in broader awareness. For us, lead generation is ultimately about growing a loyal customer list, leading to repeat transactions over time.
The product mix, of course, depends on the nature of the client business. Due to its intent-based nature, search is an obvious choice. However, we are also aware that we need to fill the funnel with users in the initial research phase. To that end, the Google Display Network is a great choice for always-on awareness. We usually start an advertiser on Responsive Display Ads (RDAs) as we have seen consistently high performance for this format across multiple verticals.
Our go-to audiences for prospecting are custom intent audiences or lookalikes of site visitors or converters. We then test (D&E) new display products against RDAs to try to beat their performance; recent winners have included dynamic (product feed-based) RDAs, Smart Display, Discovery Ads, and Discovery Carousel. We also keep an eye on new product releases (betas) to identify new challengers.
In the event that there is a new launch or product that requires story-telling or consumer education, we will invest in YouTube video. This takes different forms depending on the client’s vertical (pure ecommerce would use TrueView for Shopping, while retailers with physical store locations would use Location Extensions, as examples). For advertisers with walk-in goals, we have tested Local Campaigns and found the incremental growth in store visits to be well worth the investment.
Ultimately, we start with a baseline mix covering both awareness and purchase intent while seeking new products to challenge performance of incumbent ad formats.
-
Automate to generate
Our approach to automation varies according to the business needs of each client, whether it’s a set of standard tech—such as ad customizers, Smart Bidding, API connections to CRM platforms, and automated ad types—or more customised solutions like real-time reporting dashboards and budget-pacing documents with embedded spend distribution logic.
Automation is key for our franchise-based clients, who often need to juggle multiple campaigns, differing local conditions, and diverse strategies. For example, we developed a custom budget pacer that distributes a franchisee’s remaining monthly budget to their lowest CPL campaign, taking into account the campaigns’ IS Lost to Budget. From there, budget waterfalls to the campaign with the next lowest CPL and IS availability and so on.
We also use automation to optimise distribution of targeted postcodes among franchisees in crowded geographies. Our Marketing Science team can map out store locations and overlay their campaign geo targets on QlikSense, our dashboarding tool. From there, we can add other layers of data, mapping where each location’s conversions were coming from, drive times, and census data such as households with children under 19. As a result, we’re able to streamline geo targets to minimise overlap but maximise each location’s leads.
-
The true measure of success
The definition of success evolves as we develop the client’s digital engagement.
Stage 1: At the beginning of our journey with clients, we agree on a measurement model which emphasises conversion-based lower funnel goals (leads, CPL) and engagement-based upper-funnel goals (viewable impressions, new visitors to site, view rate/% viewed for video, etc.). Usually our leads are defined as online form submissions and/or phone calls and each lead type is weighted equally. Success means beating either lead volume or CPLs YoY (alternatively, we may aim to better a client’s forecast, but this is usually based on prior year’s performance). During this time, we have our eye on establishing infrastructure for long-term success, which is growing the client’s customer base and deepening each customer’s relationship with the client, thereby increasing customer lifetime value.
Stage 2: We start to assign quantitative value to each conversion type. We will usually engage with our preferred call-tracking partner, Invoca. This allows us to use speech monitoring to score phone call leads. We will switch the phone lead definition to calls with a score of >6/10 and start using this metric for Smart Bidding. Forms are also assigned a score out of 10 based on feedback from the client. In this transitional phase, we keep an eye on both total leads as well as total scores coming from those leads.
Stage 3: The final stage involves assigning a dollar value to each conversion type based on client’s post-lead sign-up rates and revenue per sign-up. The goal is to move from leads-based Smart Bidding to a more nuanced revenue-based optimisation. We are aware that each acquired customer brings more than just revenue at the moment of sign-up, so as this measurement strategy develops, we work with client to determine lifetime value. Our goal is to eventually assign each lead an average revenue based on CLV. Our success metric switches to revenue/ROAS, but we also look at customer retention and growth.
Sink or swim in the pandemic era
To see how this all works in the real world, we turn now to our aforementioned client, a leader in children’s swim instruction. Given the in-person nature of swim instruction and parents’ hesitancy on high-touch surfaces such as changing rooms, 2020 was a tough year, even after stay-at-home orders were lifted. In April 2020, Google Trends data showed a -94% decline in swim lesson searches and a -96% decline in brand name searches.
Our mission in 2021 was to use paid digital media for all aspects of COVID recovery, including accelerated lead generation, re-hiring staff, and regaining brand awareness. Our success criterion for lead generation was beating the 2019 pre-pandemic baseline of peak season (early Summer) lead totals, which would indicate total recovery.
Our measurement strategy has evolved and we are currently in Stage 2, meaning: lead generation is measured in online form submissions and Invoca phone calls scoring above 6; given the length of the form, job applications are measured in form starts and Invoca connected calls; and brand awareness tactics are measured through a number of engagement metrics including CTR and unique reach.
Search
The core of our lead gen program due to its intent-driven nature and closeness to conversion. Three breakthroughs allowed us to boost lead growth:
-
- Custom Budget Pacer: Designed to cascade budget into the next lowest CPL campaign with IS availability. This allowed us to effectively manage many franchisee budgets across hundreds of campaigns. We responded to increases in market demand fast, scaling spend efficiently during peak season. By July 2021, IS Lost to Budget had decreased -20% MoM and -35% YoY.
- Resourceful Smart Bidding: At first, franchisees’ individual campaigns did not have enough data to power autobidding. We put all franchisee campaigns under a single tCPA strategy to benefit from aggregation. Eventually, lead momentum allowed us to assign each franchisee their own tCPA and adjust the target based on their needs.
- Scaling Nonbrand: This was essential to making up lost ground. Prior to 2020, keyword matching focused on Brand only, which was not conducive to customer growth. Under DAC’s management our first priority was restructuring to control Brand and NB budgets separately and efficiently growing NB spend.
Local Ads
Walk-ins present the best opportunity to sign up a new customer, so we launched Local Ads, driving thousands of additional store visits during May-July.
️ Display
We started with RDAs (prospecting and remarketing). We then tested Discovery Ads head-to-head, resulting in a -62% drop in Display CPLs and a +38% growth in CTR. We did another head-to-head test of Discovery vs Discovery Carousel, which resulted in a +65% increase in CTR and a +9% increase in CVR.
▶️ Video
We used YouTube to generate awareness around new school openings, as well as to introduce potential hires to the client’s mission. Because our client is a family-oriented company, we used device bid modifiers to appear on large household screens only, reaching the entire family at the same time.
Breathtaking performance in choppy waters
As we prepare to transition to Stage 3 of our measurement strategy—using average CLV to assign revenue to conversion types, eventually optimising to ROI—we can take stock of our successes to date.
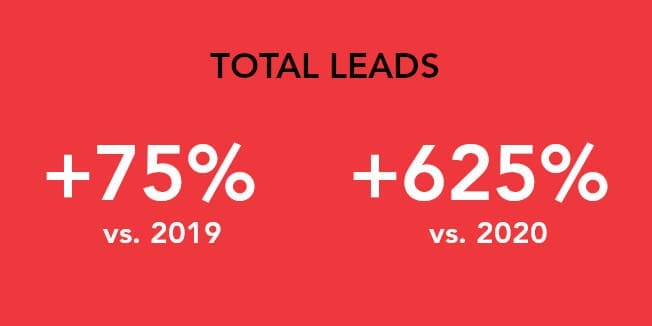
Of course, we can only reveal so many details about any given engagement, but in this instance the headline says it all: we drove a hugely impressive +75% increase in total leads vs. 2019, and an almost-unbelievable +625% vs. 2020. We also significantly improved media ROI and slashed CPL for new enrollments.
It’s testament to a number of factors that make DAC one of the world’s most significant Performance Marketing Agencies, including but not limited to our unique Enterprise-to-Local expertise, our impossibly talented teams across North America and Europe, and our priceless partnership with Google.
Could we drive the same stellar performance for your brand? There’s really only one way to find out—and it all starts with a friendly chat. Let’s talk!


